
[share_icons]
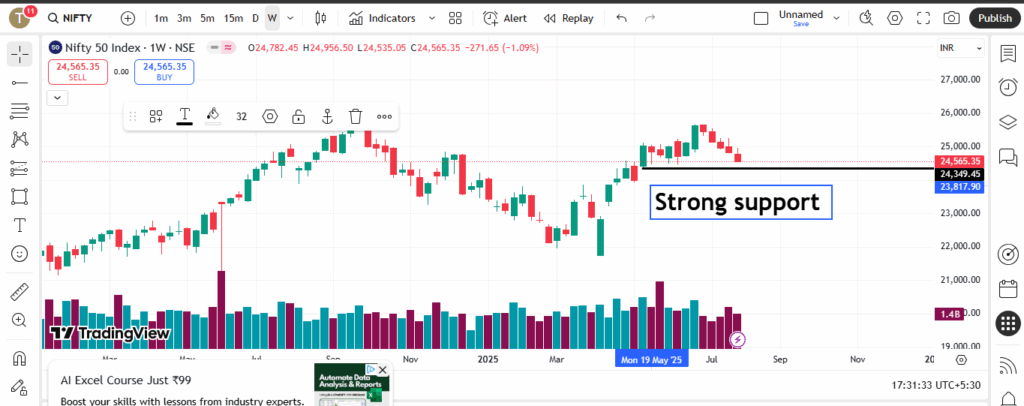
In recent weeks, Nifty 50 has been trading within a defined range in the weekly time‑frame. After consolidating, it suddenly broke out on a big green candle—prompting aggressive buying by retail participants. That, in turn, attracted operators who carefully reversed positions, resulting in a sharp turnaround. Now, sentiment has cooled.
Technical Framework & Trading Thesis
- Range‑bound behavior: For the past few months, Nifty 50 has oscillated in a lateral trading zone before a decisive breakout via a bullish weekly bar.
- Retail overdrive then flip: Buyers rushed in post‑breakout, but professional operators reversed quickly—causing market to reverse sharply.
- Support at ~24,350: A stoppage zone around 24,350 is now viewed as a strong support. If this level holds, it could offer a fresh buying opportunity.
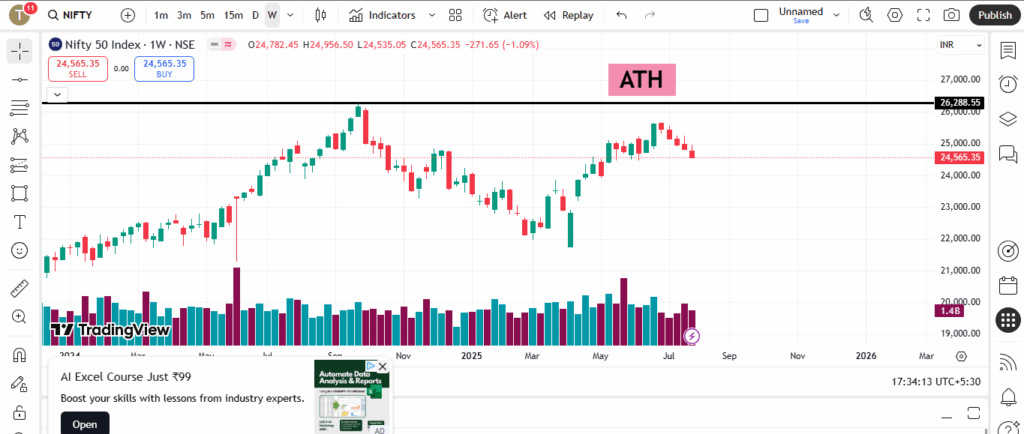
- Target near 26,300: Should price dip just to hit stop‑losses, the market may rebound with strength and push toward new all‑time highs around ~26,300. That was near previous record highs from September 2024 at ~26,216 closing/26,277 intraday NSE India Archives+5Groww+5PrimeInvestor+5.
Why Fundamentals Back the Technical Setup
Market capitalization & structure
- Nifty 50 represents 50 of the largest publicly traded Indian firms, comprising about 55.5% of free‑float market cap on NSE as of March 28, 2025 Screener+3Nifty Indices+3PrimeInvestor+3.
- Total market cap stands around ₹1.94 lakh crore (₹1,93,71,848 Cr) with a current index P/E of about 21.7× and price-to-book of 3.35× Screener.
Sector and valuation context
- Financial services form the largest segment (~32 % weight), followed by IT (~14 %), oil & gas, consumer goods and automotive sectors Wikipedia.
- The financial sector trades at a forward P/E of ~20×—slightly below the 10‑month average of ~20.6×, suggesting potential upside if credit growth continues in FY 2026 m.economictimes.com+2Reuters+2m.economictimes.com+2.
Institutional ownership trends
- Domestic Institutional Investors (DIIs) have raised their stake in Nifty 50 to a record 23.6% as of March 2025, up ~240 basis points YoY and ~40 bps QoQ Screener+2m.economictimes.com+2Nifty Indices+2.
- Foreign Institutional Investors (FIIs), by contrast, have reduced their holdings to around 24.7%, for the fourth consecutive quarter m.economictimes.com.
Growth and earnings
- Earnings growth for Nifty 50 in the past year expanded ~21.5%, versus index returns ~25%, showing valuations are pricing in forward performance PrimeInvestor.
- Financials within the index posted ~20% gains in FY 2025, outperforming index growth of ~5%. Banks gained ~9% in March alone as credit flow expectations rose Reuters.
Promoter & public holdings
- As an index, individual component metrics vary widely (e.g. Reliance, HDFC, Infosys). Overall public & institutional holdings dominate free float. Promoter stakes in index firms tend to remain stable, with most large caps largely debt‑free or low debt.
How This Informs a Trading/Investment Setup
- Stop‑loss around 24,350: Technical header level where operator strength may emerge. If breached, retail stop‑loss cascade may occur.
- Reversal zone: A bounce off that support may trigger aggressive re‑entry, propelling the index toward prior all‑time highs (~26,200–26,300).
- Catalysts in place: Renewed credit growth, upcoming RBI rate cuts (anticipated in April and August 2025), strong institutional buying (especially DIIs), and financial sector outperformance could support the rally Reuters.
Summary Table
| Metric | Value / Insight |
|---|---|
| Index P/E | ~21.7× (price to earnings) |
| DII Holding | ~23.6%, record high |
| FII Holding | ~24.7%, declining for 4th quarter |
| Earnings Growth YoY | ~21.5%; index return ~25% |
| Technical Support | ~24,350 as near-term stop‑loss zone |
| Target if reversal | ~26,300 (break previous all‑time highs) |
Disclaimer: This analysis is for educational purposes only and does not constitute financial advice. Investors should consult their financial advisors before investing.


nice