
[share_icons]
Technical Outlook
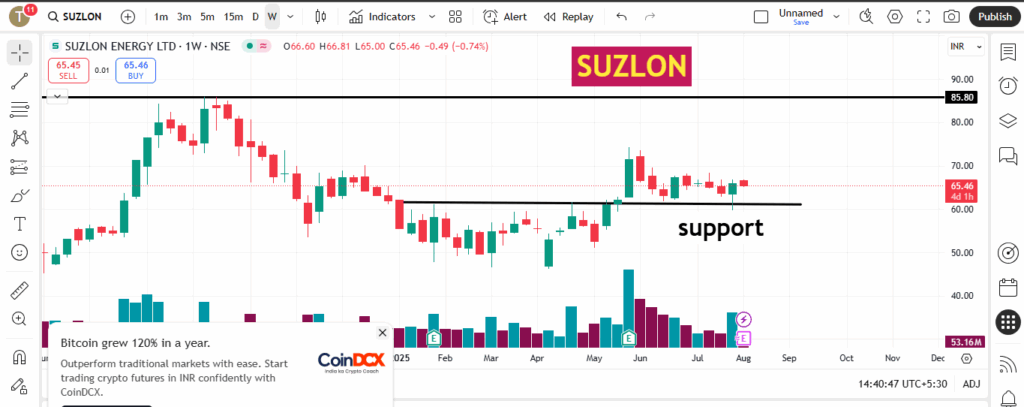
Suzlon Energy has formed a range-bound pattern in the weekly timeframe and recently broke past resistance near ₹60–65. Now trading at ₹65.47, the stock’s breakout indicates fresh buying opportunities. The ₹60–65 zone, which previously acted as resistance, has flipped into a strong support area. Investors entering within this range with a stop‑loss just below ₹60 may target ₹85–100 over a 12–15 month horizon.INDmoney+8Kotak Securities+8RetireWithRohit.com+8
Fundamental Highlights
Company Profile & Market Capitalization
- Suzlon Energy Ltd is a leading Indian wind turbine manufacturer founded in 1995 and headquartered in Pune.Wikipedia+1Value Research Online+1
- As of mid‑2025, its market capitalization ranges between ₹88,000–90,400 crore.HDFC Sky+4Screener+4Screener+4
Debt Position
- The company is now almost debt-free, with a significantly reduced debt load compared to prior years.Moneycontrol+2Screener+2Screener+2
Revenue & Profit Growth
- In Q4 FY24–25, revenue surged to ₹3,774 Cr, up ~27% YoY; net profit jumped to ₹1,182 Cr—an impressive ~205% quarterly growth.INDmoneyMarketsMojoHDFC Sky
- Annual financials for FY25: revenue of ₹10,993 Cr and profit after tax of ₹2,072 Cr, versus ₹6,529 Cr revenue and ₹660 Cr profit in FY24.MarketsMojoValue Research OnlineKotak Securities
- The company has delivered ~22.9% CAGR in profits over the last five years.trendlyne.com+2Screener+2Screener+2
Promoter & Institutional Holdings
- Promoter holding stands at ~11.74%, down from ~13.3% a quarter ago. No promoters have pledged shares.Moneycontrol+7trendlyne.com+7Value Research Online+7
- FII/FPI holding ~23.0%; Domestic Institutional Investors 10.2%; Mutual Funds ~5.24%; Public holds ~55.1%.INDmoney+2trendlyne.com+2Kotak Securities+2
Valuation, Efficiency, and Sector Context
- PE ratio is high—between ~42–44× trailing earnings; P/B ratio is ~14×–16×. Industry P/E is ~50×.ScreenerValue Research OnlineHDFC Sky
- Return on Equity (ROE) is ~39%; ROCE ~32%; Net margin ~18–19%.Value Research Online
- Suzlon operates in the capital goods / turbine manufacturing sector. Sector PE averages around ~50×.Wikipedia
Why ₹60–65 Is a Buy Zone
- On the weekly chart, resistance in the ₹60–65 range has turned into support. A successful breakout and retest signal that operators are consolidating positions, making it an opportune entry zone.RetireWithRohit.comINDmoney
- Stop-loss just below ₹60 protects against downside if momentum falters.
- Upside potential: A full rally to ₹85–100 implies
30–50% upside, aligned with previous 52-week high (₹86) and technical patterns like cup‑and‑handle forming near ₹72.RetireWithRohit.com
Risk & Reward Considerations
- High valuation: PE of ~43× is rich, though comparable to the sector. Future upside may depend on continued revenue, margin expansion, or further profit growth commentary.Value Research OnlineScreener
- Promoter dilution: Promoter stake is low, and recently declining. Risk of management misalignment or lack of direct control.trendlyne.comRetireWithRohit.com
- Volatility: A majority of shareholding (~55%) is retail, which may cause sharp swings on news or sentiment shifts.
Summary Table
| Metric | Value / Insight |
|---|---|
| 52‑Week High / Low | ₹86 / ₹46 |
| Dividend Yield | 0% |
| Support Zone | ₹60–65 |
| Stop Loss | Below ₹60 |
| Target Range | ₹85–100 |
| Time Horizon | 12–15 months |
| Market Cap | ₹88,000–90,400 Cr |
| PE Ratio | ~42–44× |
| P/B Ratio | ~14–16× |
| ROE / ROCE | ~39% / ~32% |
| Profit Margin | ~18–19% |
| Promoter Holding | ~11.7% (declining) |
| FII / DII / MF / Public | ~23% / 10.2% / 5.2% / 55.1% |
Final Verdict
Suzlon Energy has evolved from a high-debt, volatile stock into a debt‑free (or near debt‑free) company with strong earnings growth and renewed investor interest. Its recent breakout above ₹60–65 opens a strategic entry window for investors targeting ₹85–100 over the next year to 15 months. While elevated valuation and low promoter skin-in-the-game pose risks, strong fixes like rising institutional interest, massive order book, and favorable regulatory tailwinds support the bullish case.
Entering within the ₹60–65 range with a tight stop loss and realistic expectations could offer attractive risk‑reward if Suzlon sustains momentum and capitalizes on the wind energy growth cycle.
Disclaimer: This analysis is for educational purposes only and does not constitute financial advice. Investors should consult their financial advisors before investing.