

[share_icons]
Current Price: ₹517
52-Week High/Low: ₹635 / ₹282.20
Buying Zone: ₹540 – ₹550
Target: ₹800+
Duration: 8–12 months
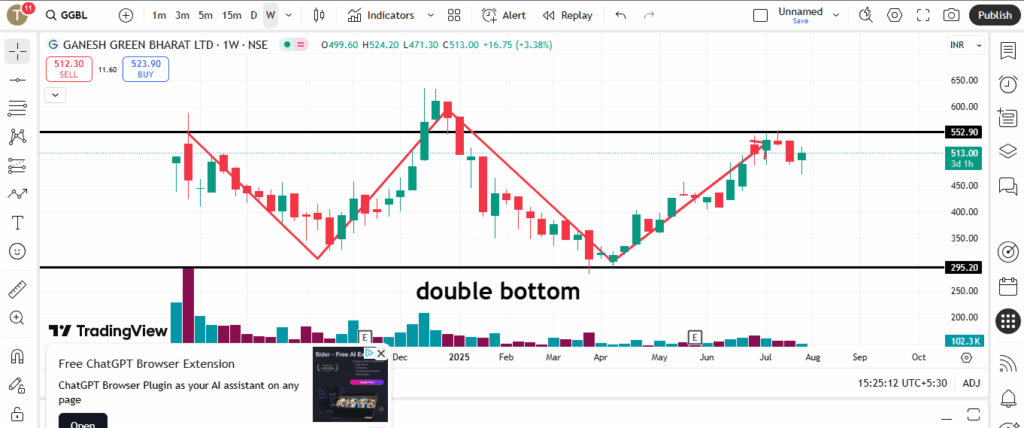
Ganesh Green Bharat Ltd (GGBL) is gaining investor attention after forming a strong double bottom pattern on the weekly chart—a classic bullish reversal signal. This technical setup, when combined with a rising channel pattern, gives traders and investors multiple confirmations of a potential breakout and sustained uptrend in the coming months.
Technical Analysis: Bullish Patterns Signal Breakout
- Double Bottom Pattern (Weekly Timeframe):
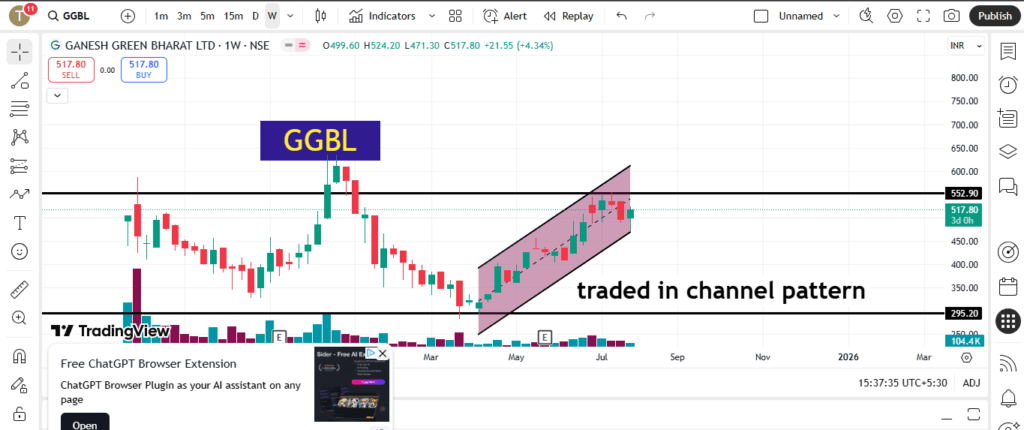
GGBL has recently completed a double bottom near its 52-week low. This pattern is considered a powerful signal for long-term trend reversals and often precedes major rallies. - Channel Pattern Support:
The stock has been trading inside a rising channel, bouncing off support zones and heading towards the resistance line. If the stock crosses the ₹550 zone with strong volume, it may test ₹800 levels in the next 8–12 months.
Company Overview: Solar & Infrastructure Focus
Ganesh Green Bharat Ltd, founded in 2016 and listed in 2023, is a fast-growing company in the renewable energy and infrastructure space. The company:
- Manufactures solar PV modules
- Executes solar EPC projects
- Handles water supply & smart metering projects across 14 states
- Delivered over ₹220 crore worth of projects
- Installed more than 2.5 lakh solar modules
Financial Performance & Fundamentals
Market Cap: ~₹1,230–1,280 crore
Debt-to-Equity Ratio: 0.88 – moderate debt
FY25 Revenue: ₹318 crore (up ~45% YoY)
FY25 Net Profit: ₹30 crore (up 100% YoY)
EPS (FY25): ₹12.5 approx
EBITDA Margin: 15–22%
ROE (Standalone): 33%+
ROCE (Standalone): ~30%
These strong numbers reflect impressive growth in profitability, suggesting the company is scaling well with increasing efficiency.
Valuation Metrics
- P/E Ratio: 39x – 42x
- P/B Ratio: ~20x (valuation premium compared to sector)
- Sector: Renewable energy & infrastructure
- Sector Avg. P/E: 20x – 30x
The stock trades at a premium, indicating strong investor sentiment and expected future growth. However, high valuations also demand continued earnings performance to sustain upside.
Shareholding Pattern
- Promoter Holding: 73.4% – Strong promoter control
- Public Holding: ~24–26%
- FIIs: 1.45%
- DIIs: 1.03%
Low institutional holdings suggest potential room for future entry by large investors, which could boost price.
Summary & Investment Outlook
| Factor | Details |
|---|---|
| Technical Setup | Double bottom + channel breakout |
| Buying Range | ₹540–550 |
| Target Price | ₹800+ |
| Timeframe | 8–12 months |
| Sector | Solar, EPC, Infrastructure |
| Growth & Profitability | Strong YoY growth, high margins |
| Risk | Moderate debt, high valuation |
Disclaimer:
This article is for informational purposes only and does not constitute investment advice. Stock investing involves risk. Please consult a SEBI-registered financial advisor before making any investment decisions. Past performance does not guarantee future results.