[share_icons]
52‑Week High: ₹1,074.90
52‑Week Low: ₹854.15
Current Price (CMP): ₹1,053 (approx)
Buying Zone: ₹950–₹1,050
Stop‑Loss: Below ₹900
Target (15–24 months): ₹1,500–₹2,000
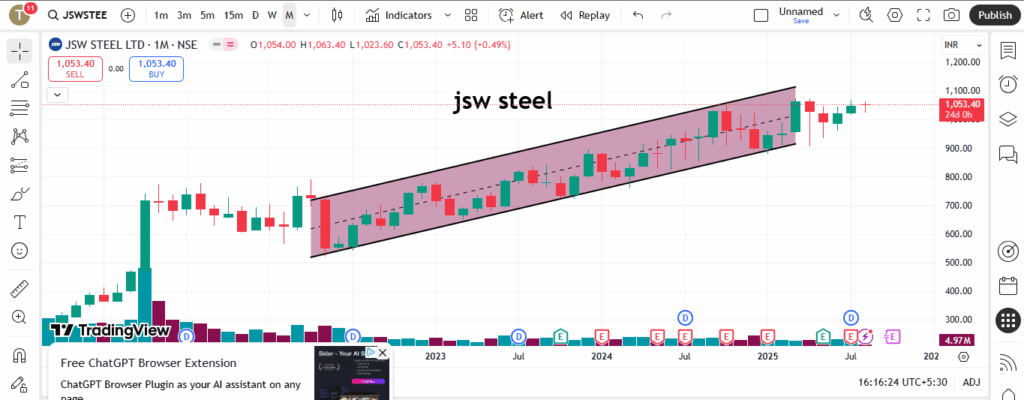
Technical View: Momentum & Breakout Patterns
- On the weekly chart, JSW Steel is forming a 45° ascending pattern, reflecting a steady uptrend. It recently broke above the psychological level of ₹1,000 and is sustaining above it—a bullish signal that suggests renewed buyer confidence.
- The breakout past ₹1,000 and holding above that level in the weekly timeframe supports your thesis: the ₹950–₹1,050 zone represents a solid buying area, with prior resistance converting into strong support—ideal for disciplined entry.
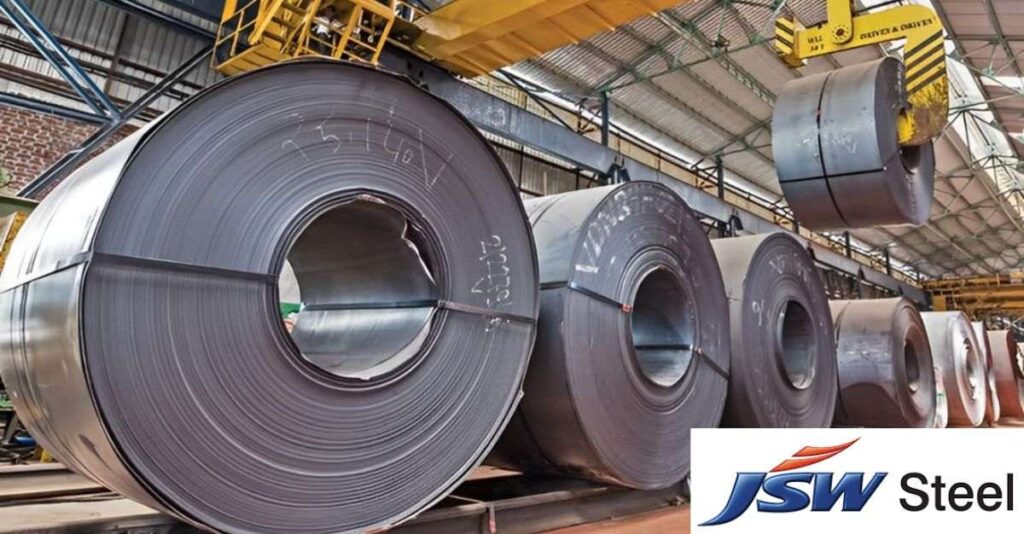
Fundamentals: Strength Amid Growth
Company & Market Overview
- JSW Steel is the flagship steel company of the JSW Group, and India’s largest private-sector steel producer after several major mergers Screener+1Sheretarget.
- Its market capitalization stands at approx ₹2,53,000–₹2,58,000 crore (~$30–$32 billion) as of mid-2025 DhanYahoo FinanceAdelaide Now.
Debt & Financial Health
- Net debt stood around ₹76,563 crore as of March 31, 2025, with net gearing (debt/equity) of 0.94× and net debt/EBITDA at 3.34×, signaling manageable leverage and improving balance sheet strength JSW Group.
Income & Growth
- Q1 FY26 (June 2025) consolidated net profit surged to ₹2,209 crore—an impressive 2.2× YoY rise—driven by volume growth and cost efficiency simplywall.st+15valueresearchonline.com+15economictimes.indiatimes.com+15.
- In Q4 FY25, consolidated net profit rose 13.5% QoQ to ₹1,501 crore (up from ₹1,322 crore a year ago) timesofindia.indiatimes.com.
- Analysts expect double-digit revenue growth through FY 26–27, with the company investing ₹60,000 crore in capacity expansion and operational upgrades timesofindia.indiatimes.com.
Valuation Metrics
- JSW Steel trades at a trailing P/E of ~49× and P/B around ~3.1×—modestly high given strong performance, but roughly in line with peers indmoney.com.
- Return on Equity (ROE) is moderate, ~4–7%, while ROCE is ~7–8% over past three years and improving volatility-adjusted returns ScreenerDhan.
- Revenue growth forecast is around 11% CAGR over the next three years, slightly outperforming the broader metals industry average of ~10% simplywall.st.
Shareholding Pattern
- Promoter stake rose to 45.31% in June 2025 (from 44.84% in March 2025), with pledged shares under 1% indmoney.com+4trendlyne.com+4marketsmojo.com+4.
- FII holding stands at ~25.4% (slightly down), DIIs at ~10.9%, and Mutual Funds are now ~4.25% (up QoQ) trendlyne.com+3marketsmojo.com+3indmoney.com+3.
- The balance (~17–18%) is held by retail and others—a well-distributed ownership structure aliceblueonline.com.
Why JSW Steel Looks Compelling as a Trade
1. Technical Trigger
Your observation of the steady 45° uptrend and sustainable breakout above ₹1,000 is significant. Holding that level suggests a durable bullish structure and makes ₹950–₹1,050 a lower-risk entry band.
2. Strong Historical Returns
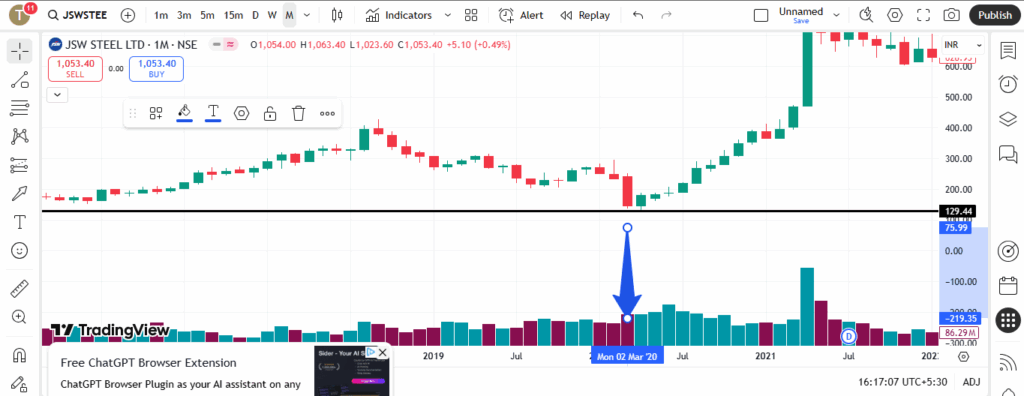
The stock has risen from ~₹130 in 2020 to over ₹1,050 in 2025—roughly a 700% return in 5 years. This underscores its strong performance trajectory and resilience through commodity cycles.
3. Operational Expansion & Capacity Build-Up
JSW plans ₹60,000 crore capex over coming years, boosting output efficiency, raw material security, and EBITDA margin recovery to 18–19% in FY26–27 timesofindia.indiatimes.com.
4. Macro Headwinds & Risk Awareness
Fitch warns of margin pressure from low-cost steel imports, though domestic demand and policy support are seen as mitigating factors reuters.com+2reuters.com+2.
Trade & Long-term Setup
- Buy Zone: ₹950–₹1,050
- Stop‑Loss: Below ₹900
- Target: ₹1,500–₹2,000 (15–24 months)
- Time Frame: Medium‑term (~1.5–2 years)
Summary Table
| Metric | Value / Insight |
|---|---|
| CMP | ₹1,053 |
| Buy Zone | ₹950–₹1,050 |
| Stop‑Loss | Below ₹900 |
| Target | ₹1,500–₹2,000 |
| Duration | 15–24 months |
| Market Cap | ₹2.5 lakh crore (~$30–32 billion) |
| P/E | ~49× (trailing) |
| P/B | ~3.1× |
| Net Gearing | ~0.94× |
| Net Debt/EBITDA | ~3.34× |
| Q1 FY26 PAT Growth | 2.2x YoY (₹2,209 Cr) |
| Promoter Holding | 45.31% (unpledged shares <1%) |
| FII Holding | ~25.4% |
| DII Holding | ~10.9% |
| Mutual Funds | ~4.25% (rising) |
Disclaimer: This analysis is for educational purposes only and does not constitute financial advice. Investors should consult their financial advisors before investing.